dplyr
Data Transformation
dplyr
dplyr provides a grammar for manipulating tables in R. This cheat sheet will guide you through the grammar, reminding you how to select, filter, arrange, mutate, summarise, group, and join data frames and tibbles.
dplyr functions work with pipes and expect tidy data.
pipes makes x %>% f(y) becomes f(x, y)
# install.packages('nycflights13')

library(nycflights13)
library(tidyverse)
If you want to use the base version of these functions after loading dplyr, you’ll need to use their full names: stats::filter() and stats::lag().
nycflights13::flights. This data frame contains all 336,776 flights that departed from New York City in 2013.
flightsdplyr basics
key dplyr functions :
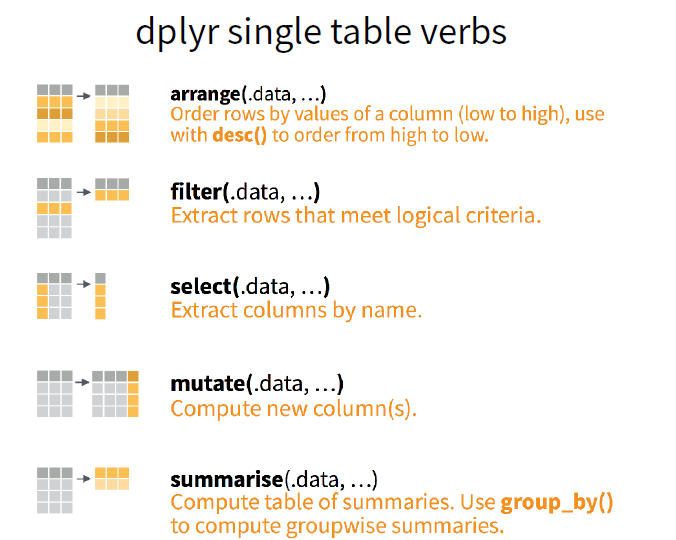
- Pick observations by their values (
filter()). - Reorder the rows (
arrange()). - Pick variables by their names (
select()). - Create new variables with functions of existing variables (
mutate()). - Collapse many values down to a single summary (
summarise()).
These can all be used in conjunction with group_by() which changes the scope of each function from operating on the entire dataset to operating on it group-by-group.
These six functions provide the verbs for a language of data manipulation.
All verbs work similarly:
- The first argument is a data frame.
- The subsequent arguments describe what to do with the data frame, using the variable names (without quotes).
- The result is a new data frame.
Summarise Cases
These apply summary functions to columns to create a new table of summary statistics. Summary functions take vectors as input and return one value.

- summarise(.data, …) : Compute table of summaries.
summarise(mtcars, avg = mean(mpg))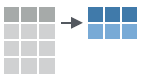
- count(x, …, wt = NULL, sort = FALSE) : Count number of rows in each group defined by the variables in … Also tally().
count(iris, Species)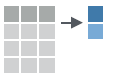
VARIATIONS
- summarise_all() - Apply funs to every column.
- summarise_at() - Apply funs to specific columns.
- summarise_if() - Apply funs to all cols of one type.
Group Cases
Use group_by() to create a “grouped” copy of a table. dplyr functions will manipulate each “group” separately and then combine the results.
- group_by(.data, …, add = FALSE) : Returns copy of table grouped by …
g_iris <- group_by(iris, Species)ungroup(x, …) : Returns ungrouped copyof table.
ungroup(g_iris)
mtcars %>%
group_by(cyl) %>%
summarise(avg = mean(mpg))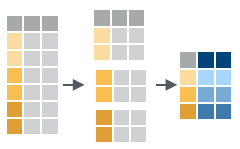
Manipulate Cases
EXTRACT CASES
Row functions return a subset of rows as a new table.
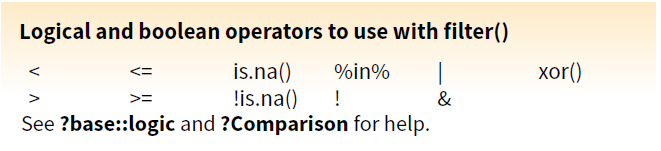
- filter(.data, …)
Extract rows that meet logical criteria.
filter(iris, Sepal.Length > 7)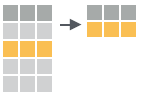
- distinct(.data, …, .keep_all = FALSE)
Remove rows with duplicate values.
distinct(iris, Species)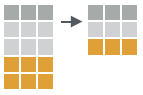
- sample_frac(tbl, size = 1, replace = FALSE, weight = NULL, .env = parent.frame()) :
Randomly select fraction of rows.
sample_frac(iris, 0.5, replace = TRUE)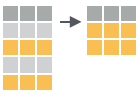
- sample_n(tbl, size, replace = FALSE, weight = NULL, .env = parent.frame())
Randomly select size rows.
sample_n(iris, 10, replace = TRUE)- slice(.data, …)
Select rows by position.
slice(iris, 10:15)- top_n(x, n, wt)
Select and order top n entries (by group if grouped data).
top_n(iris, 5, Sepal.Width)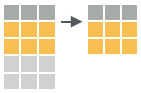
Logical and Boolean Operators
ARRANGE CASES
- arrange(.data, …)
Order rows by values of a column or columns (low to high), use with desc() to order from high to low.
arrange(mtcars, mpg)
arrange(mtcars, desc(mpg))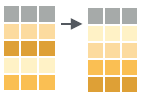
- add_row(.data, …, .before = NULL, .after = NULL)
Add one or more rows to a table.
add_row(faithful, eruptions = 1, waiting = 1)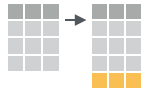
Manipulate Variables
EXTRACT VARIABLES
Column functions return a set of columns as a new vector or table.
- pull(.data, var = -1)
Extract column values as a vector. Choose by name or index.
pull(iris, Sepal.Length)
- select(.data, …)
Extract columns as a table. Also select_if().
select(iris, Sepal.Length, Species)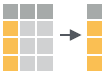
Use these helpers with select ()
select(iris, starts_with("Sepal"))- contains(match)
- ends_with(match)
- matches(match)
- mpg:cyl
- -Species
- num_range(prefix, range)
- one_of(…)
- starts_with(match)
MAKE NEW VARIABLES
These apply vectorized functions to columns. Vectorized funs take vectors as input and return vectors of the same length as output.

- mutate(.data, …)
Compute new column(s).
mutate(mtcars, gpm = 1/mpg)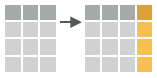
- transmute(.data, …)
Compute new column(s), drop others.
transmute(mtcars, gpm = 1/mpg)- mutate_all(.tbl, .funs, …)
Apply funs to every column. Use with funs(). Also mutate_if().
mutate_all(faithful, funs(log(.), log2(.)))
mutate_if(iris, is.numeric, funs(log(.)))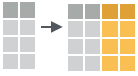
- mutate_at(.tbl, .cols, .funs, …)
Apply funs to specific columns. Use with funs(), vars() and the helper functions for select().
mutate_at(iris, vars( -Species), funs(log(.)))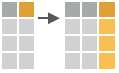
- add_column(.data, …, .before = NULL, .after = NULL)
Add new column(s). Also add_count(), add_tally().
add_column(mtcars, new = 1:32)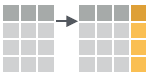
- rename(.data, …)
Rename columns.
rename(iris, Length = Sepal.Length) 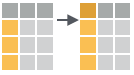
Vector Functions
TO USE WITH MUTATE ()
mutate() and transmute() apply vectorized functions to columns to create new columns. Vectorized functions take vectors as input and return vectors of the same length as output.
OFFSETS
- dplyr::lag() - Offset elements by 1
dplyr::lead() - Offset elements by -1
CUMULATIVE AGGREGATES
- dplyr::cumall()
- dplyr::cumany()
- dplyr::cummax()
- dplyr::cummean()
- dplyr::cummin()
- dplyr::cumprod()
dplyr::cumsum()
RANKINGS
- dplyr::cume_dist() - Proportion of all values <=
- dplyr::dense_rank() - rank with ties = min, no gaps
- dplyr::min_rank() - rank with ties = min
- dplyr::ntile() - bins into n bins
- dplyr::percent_rank() - min_rank scaled to [0,1]
dplyr::row_number() - rank with ties = “first”
MATH
- +, - , *, /, ^, %/%, %% - arithmetic ops
- log(), log2(), log10() - logs
- <, <=, >, >=, !=, == - logical comparisons
- dplyr::between() - x >= left & x <= right
dplyr::near() - safe == for floating point numbers
MISC
- dplyr::case_when() - multi-case if_else()
- dplyr::coalesce() - first non-NA values by element across a set of vectors
- dplyr::if_else() - element-wise if() + else()
- dplyr::na_if() - replace specific values with NA
- pmax() - element-wise max()
- pmin() - element-wise min()
- dplyr::recode() - Vectorized switch()
dplyr::recode_factor() - Vectorized switch() for factors
Summary Functions
TO USE WITH SUMMARISE ()
summarise() applies summary functions to columns to create a new table. Summary functions take vectors as input and return single values as output.
- COUNTS
- dplyr::n() - number of values/rows
- dplyr::n_distinct() - # of uniques
sum(!is.na()) - # of non-NA’s
- LOCATION
- mean() - mean, also mean(!is.na())
median() - median
- LOGICALS
- mean() - Proportion of TRUE’s
sum() - # of TRUE’s
- POSITION/ORDER
- dplyr::first() - first value
- dplyr::last() - last value
dplyr::nth() - value in nth location of vector
- RANK
- quantile() - nth quantile
- min() - minimum value
max() - maximum value
- SPREAD
- IQR() - Inter-Quartile Range
- mad() - median absolute deviation
- sd() - standard deviation
var() - variance
Row Names
Tidy data does not use rownames, which store a variable outside of the columns. To work with the rownames, first move them into a column.
- rownames_to_column()
Move row names into col.
a <- rownames_to_column(iris, var = "C")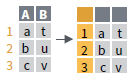
- column_to_rownames()
Move col in row names.
column_to_rownames(a, var = "C")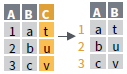
has_rownames()
remove_rownames()
Combine Tables
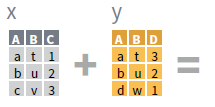
COMBINE VARIABLES
- Use bind_cols() to paste tables beside each other as they are.bind_cols(…) Returns tables placed side by side as a single table.
BE SURE THAT ROWS ALIGN.
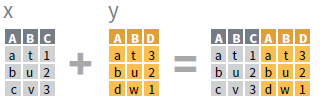
- Use a “Mutating Join” to join one table to columns from another, matching values with the rows that they correspond to. Each join retains a different combination of values from the tables.
left_join(x, y, by = NULL,
          copy=FALSE, suffix=c(“.x”,“.y”),…)
right_join(x, y, by = NULL,
           copy = FALSE, suffix=c(“.x”,“.y”),…)
inner_join(x, y, by = NULL,
           copy = FALSE, suffix=c(“.x”,“.y”),…)
full_join(x, y, by = NULL,
          copy=FALSE, suffix=c(“.x”,“.y”),…)
- Use by = c(“col1”, “col2”, …) to specify one or more common columns to match on.
left_join(x, y, by = "A")
- Use a named vector, by = c(“col1” = “col2”), to match on columns that have different names in each table.
left_join(x, y, by = c("C" = "D"))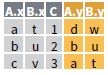
- Use suffix to specify the suffix to give to unmatched columns that have the same name in both tables.
left_join(x, y, by = c("C" = "D"), suffix =
c("1", "2"))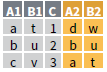
COMBINE CASES
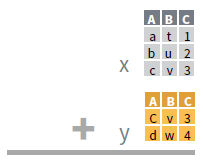
- Use bind_rows() to paste tables below each other as they are.
bind_rows(…, .id = NULL)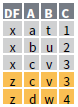
intersect(x, y, …)
setdiff(x, y, …)
union(x, y, …)
- Use setequal() to test whether two data sets contain the exact same rows (in any order).
EXTRACT ROWS
- Use a “Filtering Join” to filter one table against the rows of another.
semi_join(x, y, by = NULL, …)
anti_join(x, y, by = NULL, …)
Alternatives
There are two main alternatives to readr: base R and data.table’s fread(). The most important differences are discussed below.
Base R
Compared to the corresponding base functions, readr functions:
Use a consistent naming scheme for the parameters (e.g.
col_namesandcol_typesnotheaderandcolClasses).Are much faster (up to 10x).
Leave strings as is by default, and automatically parse common date/time formats.
Have a helpful progress bar if loading is going to take a while.
All functions work exactly the same way regardless of the current locale. To override the US-centric defaults, use
locale().
data.table and fread()
data.table has a function similar to read_csv() called fread. Compared to fread, readr functions:
Are slower (currently ~1.2-2x slower. If you want absolutely the best performance, use
data.table::fread().Use a slightly more sophisticated parser, recognising both doubled (
"""") and backslash escapes ("\""), and can produce factors and date/times directly.Forces you to supply all parameters, where
fread()saves you work by automatically guessing the delimiter, whether or not the file has a header, and how many lines to skip.Are built on a different underlying infrastructure. Readr functions are designed to be quite general, which makes it easier to add support for new rectangular data formats.
fread()is designed to be as fast as possible.